E-commerce Business Intelligence & Analytics
Granular analytics platform bridging digital data and physical retail
IKEA's e-commerce analytics were limited to **country-level aggregates**, providing no visibility into regional performance variations. Sales, merchandising, and business navigation teams had no way to understand how online customer behavior differed across markets, cities, or postal areas. This meant promotional strategies and product placement decisions were applied uniformly — ignoring significant regional differences in customer preferences and engagement patterns.
Synthesizing User Needs
Understanding the stakeholders through research
To design an effective solution, I conducted stakeholder interviews and synthesized two distinct user archetypes representing the core needs and pain points.
Actionable product-level insights to decide which items to feature in showroom hotspots for maximum in-store sales.
- No visibility into which products customers engage with online before visiting stores.
- Merchandising decisions based on gut feeling rather than data.
- Cannot correlate online browsing trends with in-store purchase behavior.
Regional performance data at the market and FSA level to develop localized e-commerce strategies.
- Analytics only available at the country level — cannot identify regional variations.
- No way to benchmark conversion rates across markets or postal areas.
- Cross-functional teams lack a shared data source for aligned decision-making.
From Data to Dashboard
A systematic approach to building the solution
Data Pipeline Architecture
How the data flows from source to insight
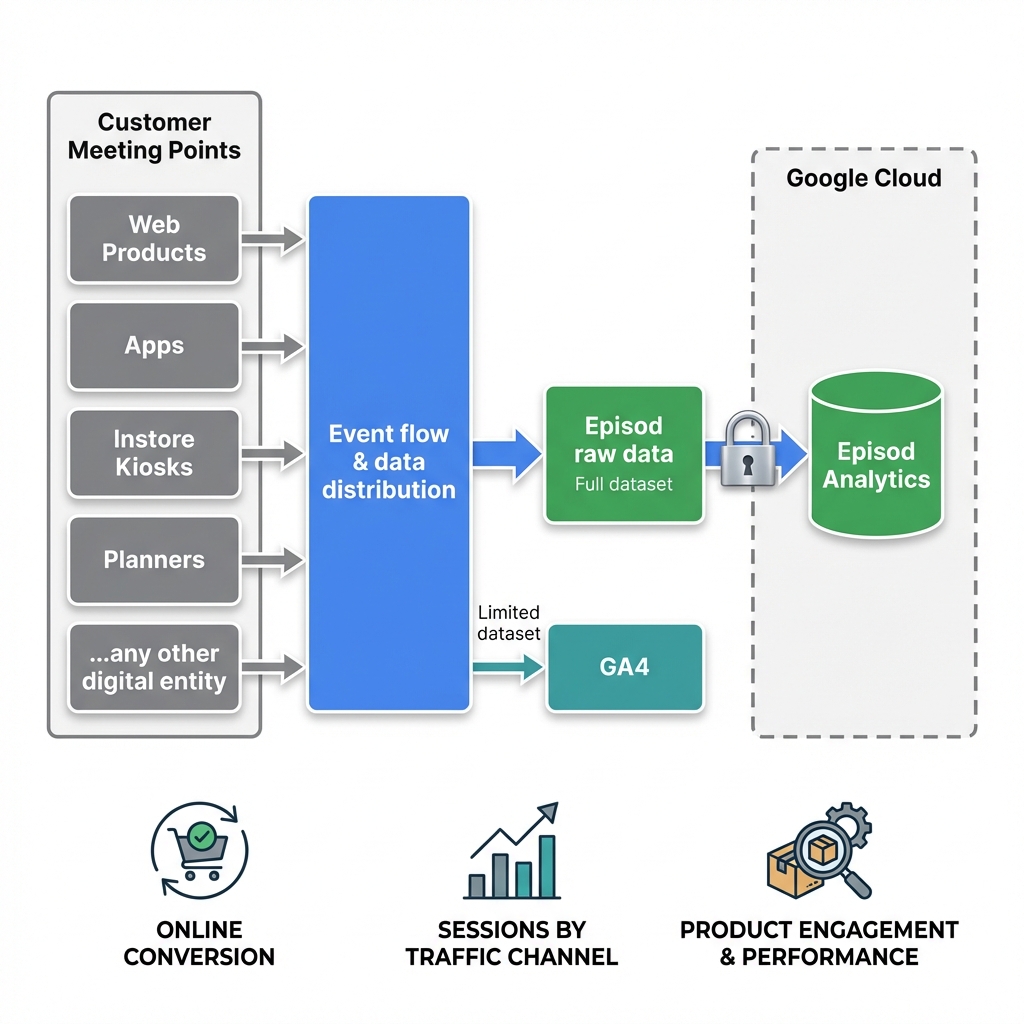
The architecture follows an event-driven analytics pattern: customer interactions across web, mobile, kiosks, and planners are captured by the EPISOD framework, which distributes raw event data to both GA4 (limited dataset) and EPISOD Analytics for processing. The processed data feeds geographic segmentation models and product engagement analytics, which are surfaced through BI dashboards enabling cross-functional teams to make data-driven merchandising and strategy decisions.
Building the Analytics Platform
Bridging online behavior with in-store merchandising decisions
An end-to-end data pipeline capturing customer interactions across all digital touchpoints — web products, apps, in-store kiosks, and planners — routing event data through the EPISOD framework and Google Cloud into unified analytics dashboards.
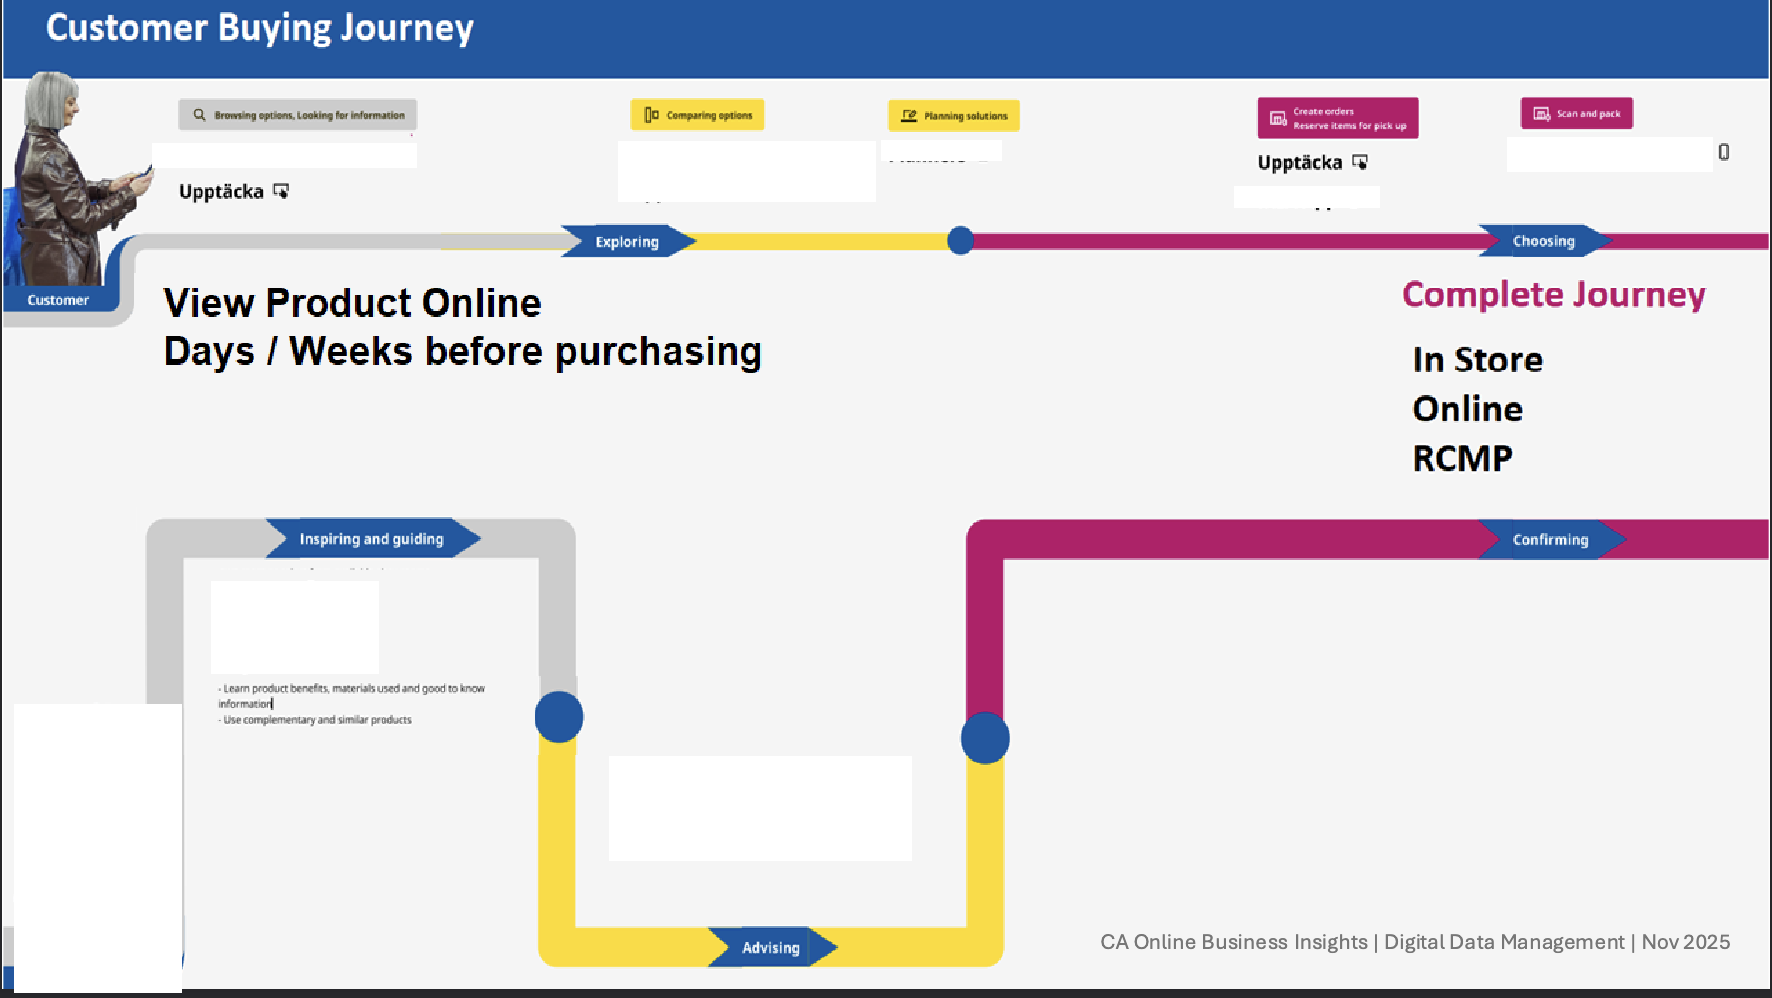
Mapped the full customer buying journey — from online exploration to in-store purchase — identifying high-engagement products and strategically placing them in showroom hotspots to double in-store sales.
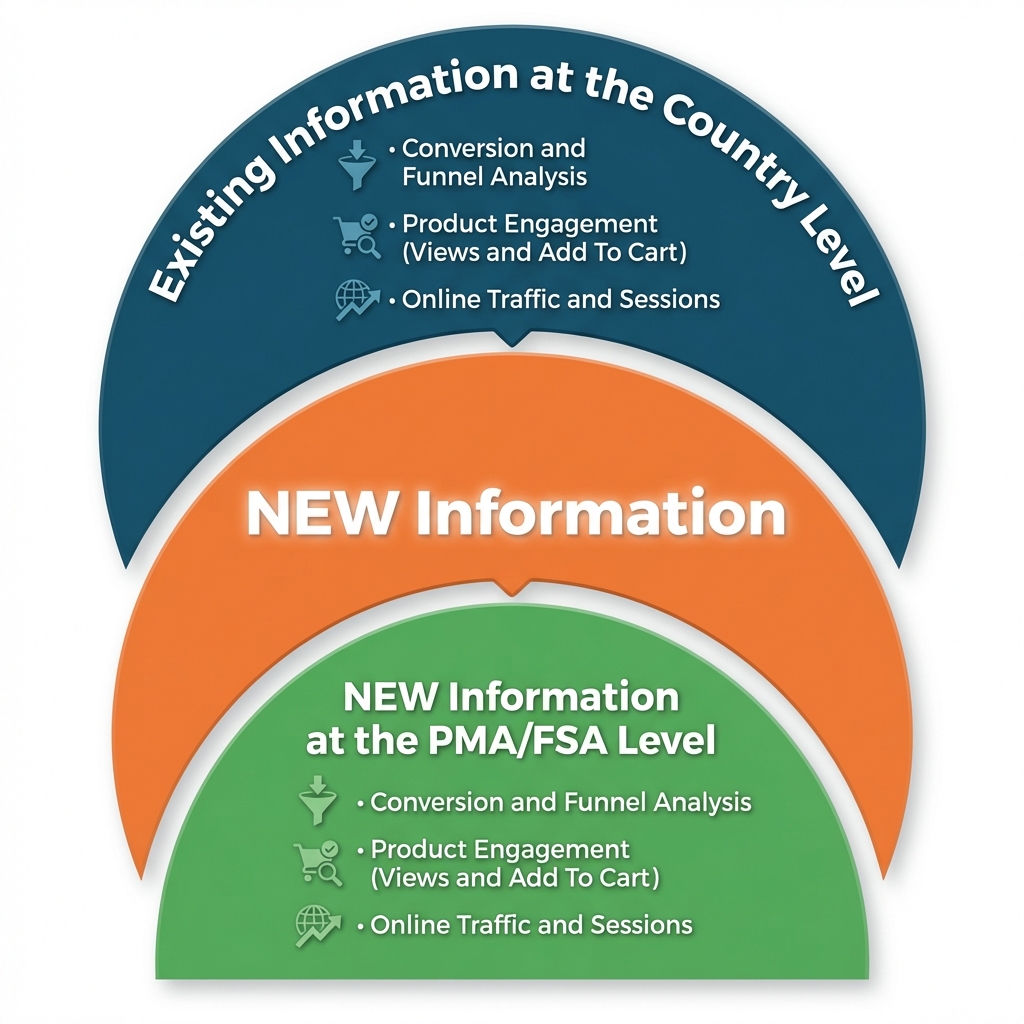
Extended analytics from country-level aggregates down to PMA and FSA regions, unlocking new insights at the market level for conversion, product engagement, and traffic analysis.
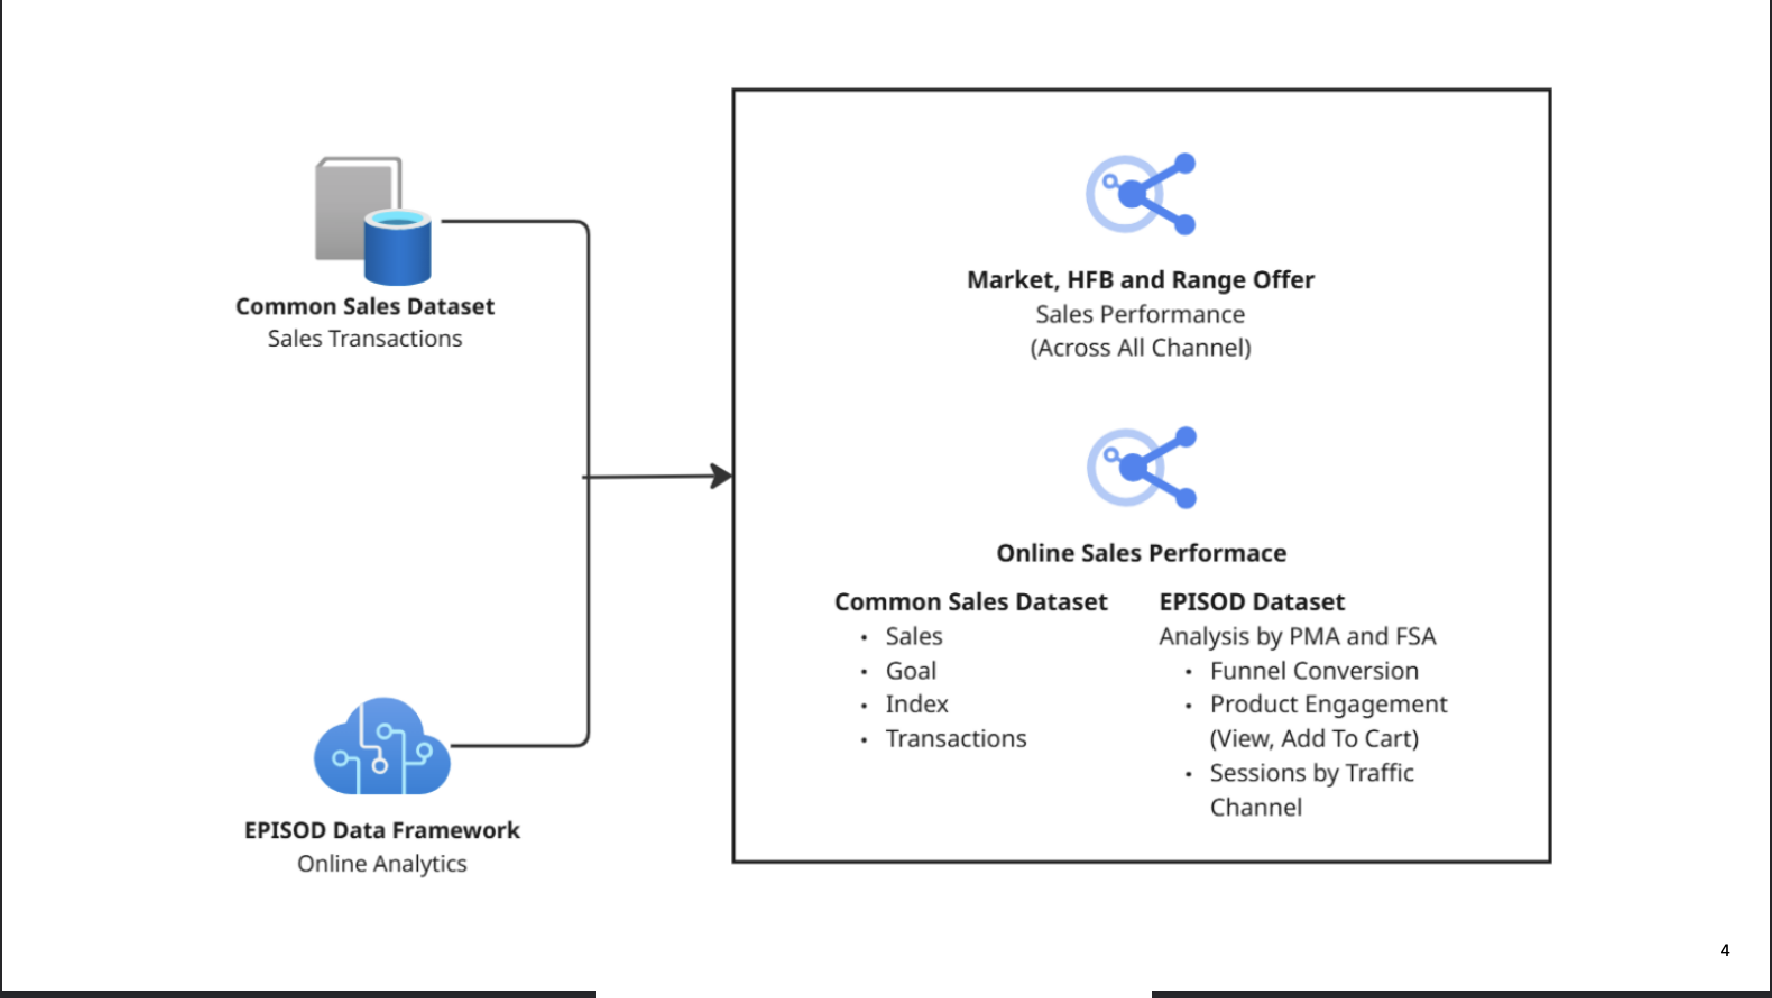
Unified Common Sales Dataset (sales, goals, transactions) with EPISOD event data (funnel conversion, product engagement, sessions by traffic channel) into a single analytics layer.
Outcome & Learnings
Reflecting on what was built and what comes next
Delivered a granular e-commerce analytics platform that extended insights from country-level to market and FSA levels, unifying omnichannel data sources and enabling data-driven merchandising that doubled in-store sales for targeted products.
The biggest insight was that online engagement data is a leading indicator for in-store demand. Bridging digital analytics with physical retail decisions created immediate, measurable business impact.
Integrate predictive analytics for sales forecasting. Build ML models for product recommendation optimization. Add real-time alerting for performance anomalies and customer segmentation via cohort analysis.