Operational Waste Mitigation and Demand Forecasting
Automated ETL pipeline reducing operational waste and improving forecast accuracy
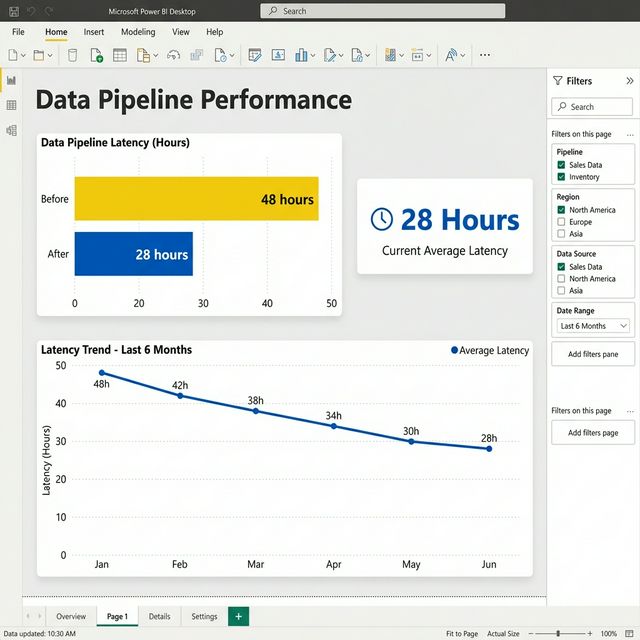
IKEA’s kitchen department faced significant operational inefficiencies due to fragmented data. Critical inventory and sales data were scattered across **10+ disconnected SharePoint sources and Excel files**, leading to a dazzling 40% data latency. This delay made it impossible to accurately forecast demand, resulting in excessive food waste and lost revenue opportunities.
Synthesizing User Needs
Understanding the stakeholders through research
To design an effective solution, I conducted stakeholder interviews and synthesized two distinct user archetypes representing the core needs and pain points.
Accurate daily demand forecasts to minimize food waste and ensure availability during peak hours.
- Relies on outdated, manual Excel spreadsheets for forecasting.
- No visibility into real-time sales data from front-of-house.
- Spends 2+ hours daily reconciling inventory discrepancies.
A centralized dashboard to monitor regional KPIs and make data-driven procurement decisions.
- Data scattered across 10+ SharePoint sites and Excel files.
- Weekly reports are often stale by the time they are compiled.
- Lacks the ability to drill down into specific department metrics.
From Data to Dashboard
A systematic approach to building the solution
Data Pipeline Architecture
How the data flows from source to insight
The architecture follows a classic data pipeline pattern: raw data is extracted from disparate sources, cleaned and transformed via Python, loaded into a central SQL database, and visualized through Power BI models for actionable insights.
Designing the Dashboard
Turning insights into actionable visualizations
An interactive Power BI dashboard providing real-time visibility into kitchen operations, procurement KPIs, and regional performance metrics.
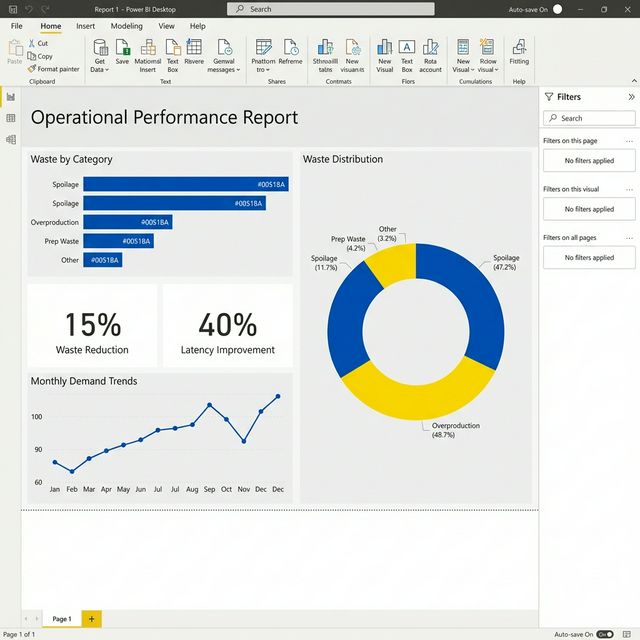
Real-time data ingestion replaced manual, batch processing.
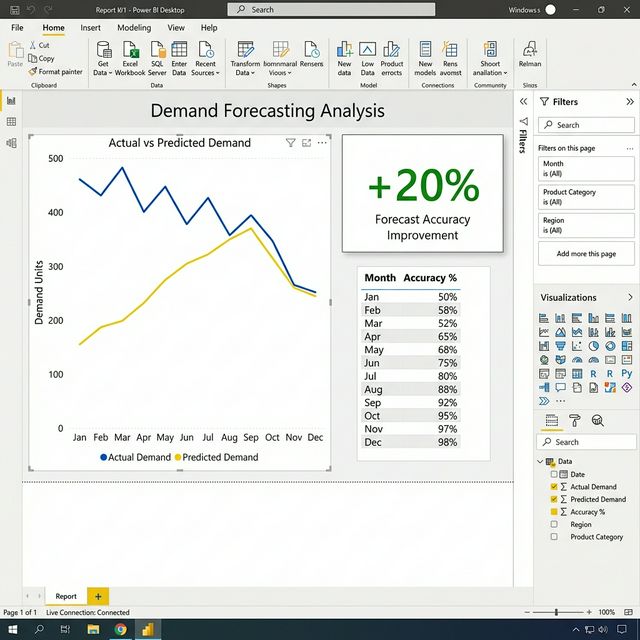
Improved predictions through historical trend analysis.
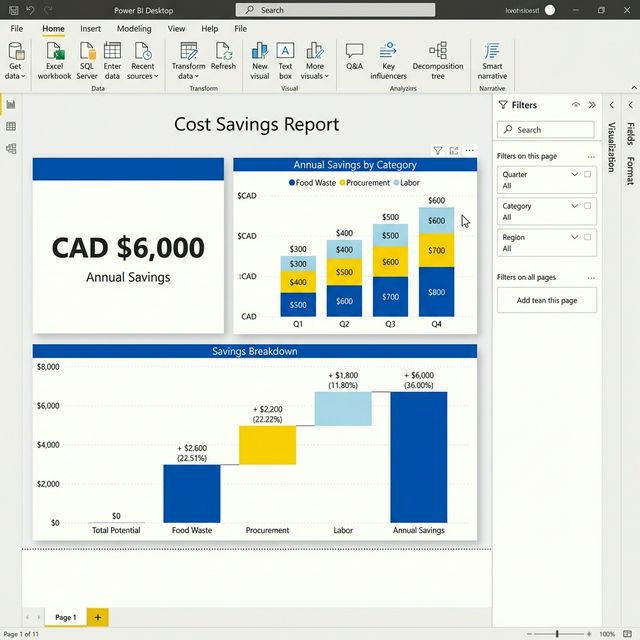
Waste reduction directly translated to cost savings.
Outcome & Learnings
Reflecting on what was built and what comes next
Successfully deployed an automated ETL pipeline that eliminated 15+ hours of manual work weekly and provided leadership with real-time dashboards.
Stakeholder alignment is critical. Early buy-in from both the kitchen and business teams ensured the dashboards met practical needs.
Integrate predictive ML models for proactive demand forecasting. Explore Azure Data Factory for enterprise-grade scheduling.